Fetch the repository succeeded.
English | 简体中文
G2 is named after Leland Wilkinson’s book The Grammar of Graphics and was profoundly inspired by it in the very beginning. Here are some resources you can begin with:
G2 is usually installed via a package manager such as npm or Yarn.
$ npm install @antv/g2
$ yarn add @antv/g2
The Chart object then can be imported from G2.
<div id="container"></div>
import { Chart } from '@antv/g2';

// A tabular data to be visualized.
const data = [
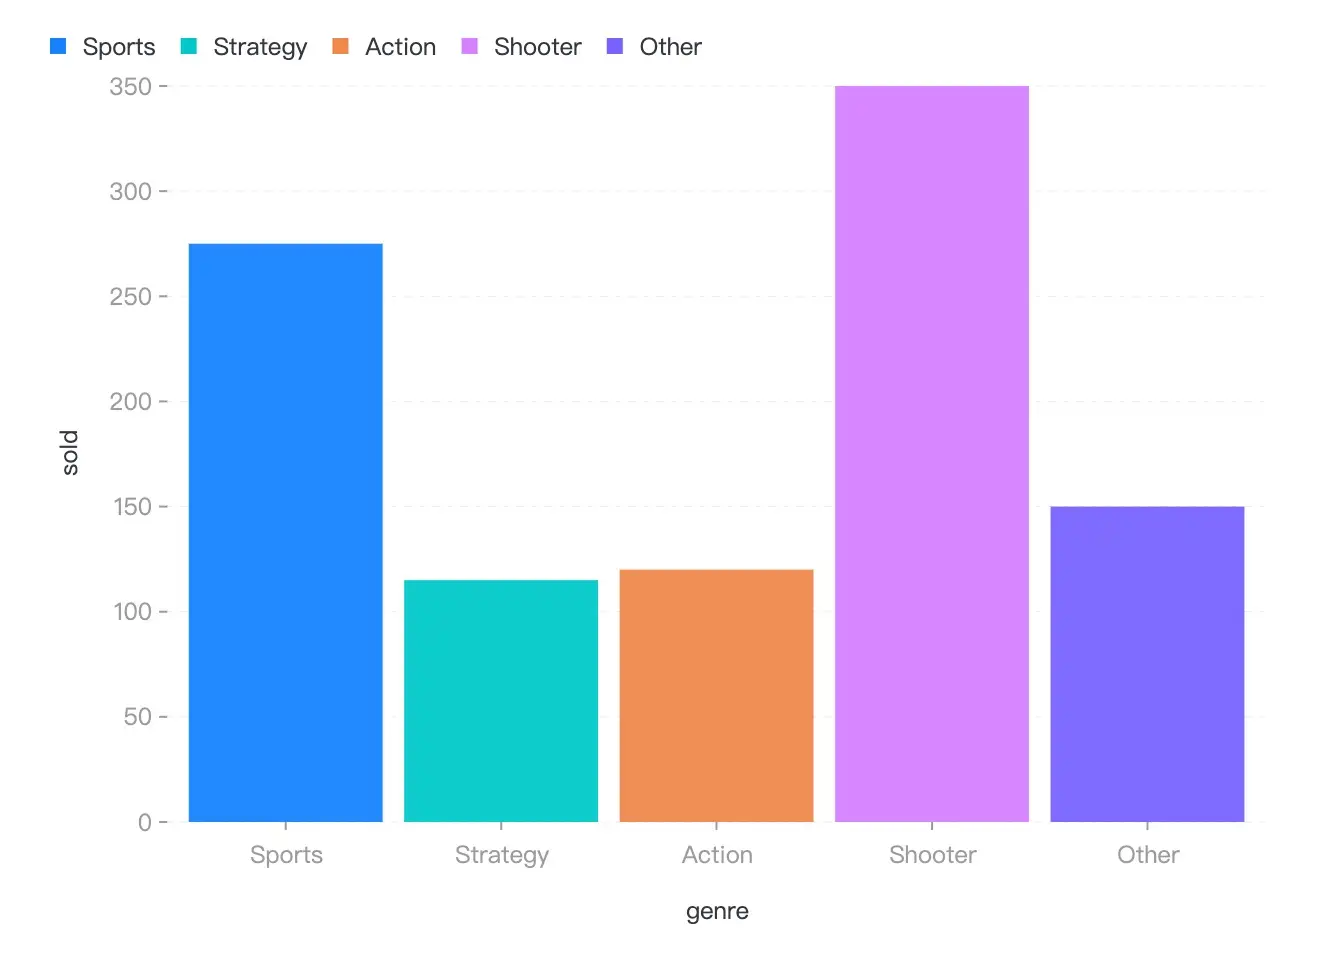
  { genre: 'Sports', sold: 275 },
  { genre: 'Strategy', sold: 115 },
  { genre: 'Action', sold: 120 },
  { genre: 'Shooter', sold: 350 },
  { genre: 'Other', sold: 150 },
];

// Instantiate a new chart.
const chart = new Chart({
  container: 'container',
});

// Specify visualization.
chart
  .interval() // Create an interval mark and add it to the chart.
  .data(data) // Bind data for this mark.
  .encode('x', 'genre') // Assign genre column to x position channel.
  .encode('y', 'sold') // Assign sold column to y position channel.
  .encode('color', 'genre'); // Assign genre column to color channel.

// Render visualization.
chart.render();
If all goes well, you can get the following lovely bar chart!


MIT@AntV.
此处可能存在不合适展示的内容,页面不予展示。您可通过相关编辑功能自查并修改。
如您确认内容无涉及 不当用语 / 纯广告导流 / 暴力 / 低俗色情 / 侵权 / 盗版 / 虚假 / 无价值内容或违法国家有关法律法规的内容,可点击提交进行申诉,我们将尽快为您处理。
1. Open source ecosystem
2. Collaboration, People, Software
3. Evaluation model